The National Association of Realtors (NAR) released the results of their latest Existing Home Sales Report which revealed that home sales declined 0.6% to a seasonally adjusted annual rate of 5.38 million in June from 5.41 million in May, and are 2.2% below a year ago. Some may look at these numbers and think that now is a bad time to sell their house, but in fact, the opposite is true.
The national slowdown in sales is directly tied to a lack of inventory available for the buyers who are out in the market looking for their dream homes! In fact, the inventory of homes for sale had fallen year-over-year for 36 consecutive months before posting a modest 0.5% gain last month and has had an upward impact on home prices.
NAR’s Chief Economist Lawrence Yun had this to say,
“It’s important to note that despite the modest year-over-year rise in inventory, the current level is far from what’s needed to satisfy demand levels. Furthermore, it remains to be seen if this modest increase will stick, given the fact that the robust economy is bringing more interested buyers into the market, and new home construction is failing to keep up.”
The few houses that are on the market are selling fast! According to NAR’s Realtors Confidence Index, properties were typically on the market for 26 days.
Bottom Line
If you are one of the many homeowners who is debating listing your house for sale this year, the time is now! Let’s get together to discuss the specifics of our market!

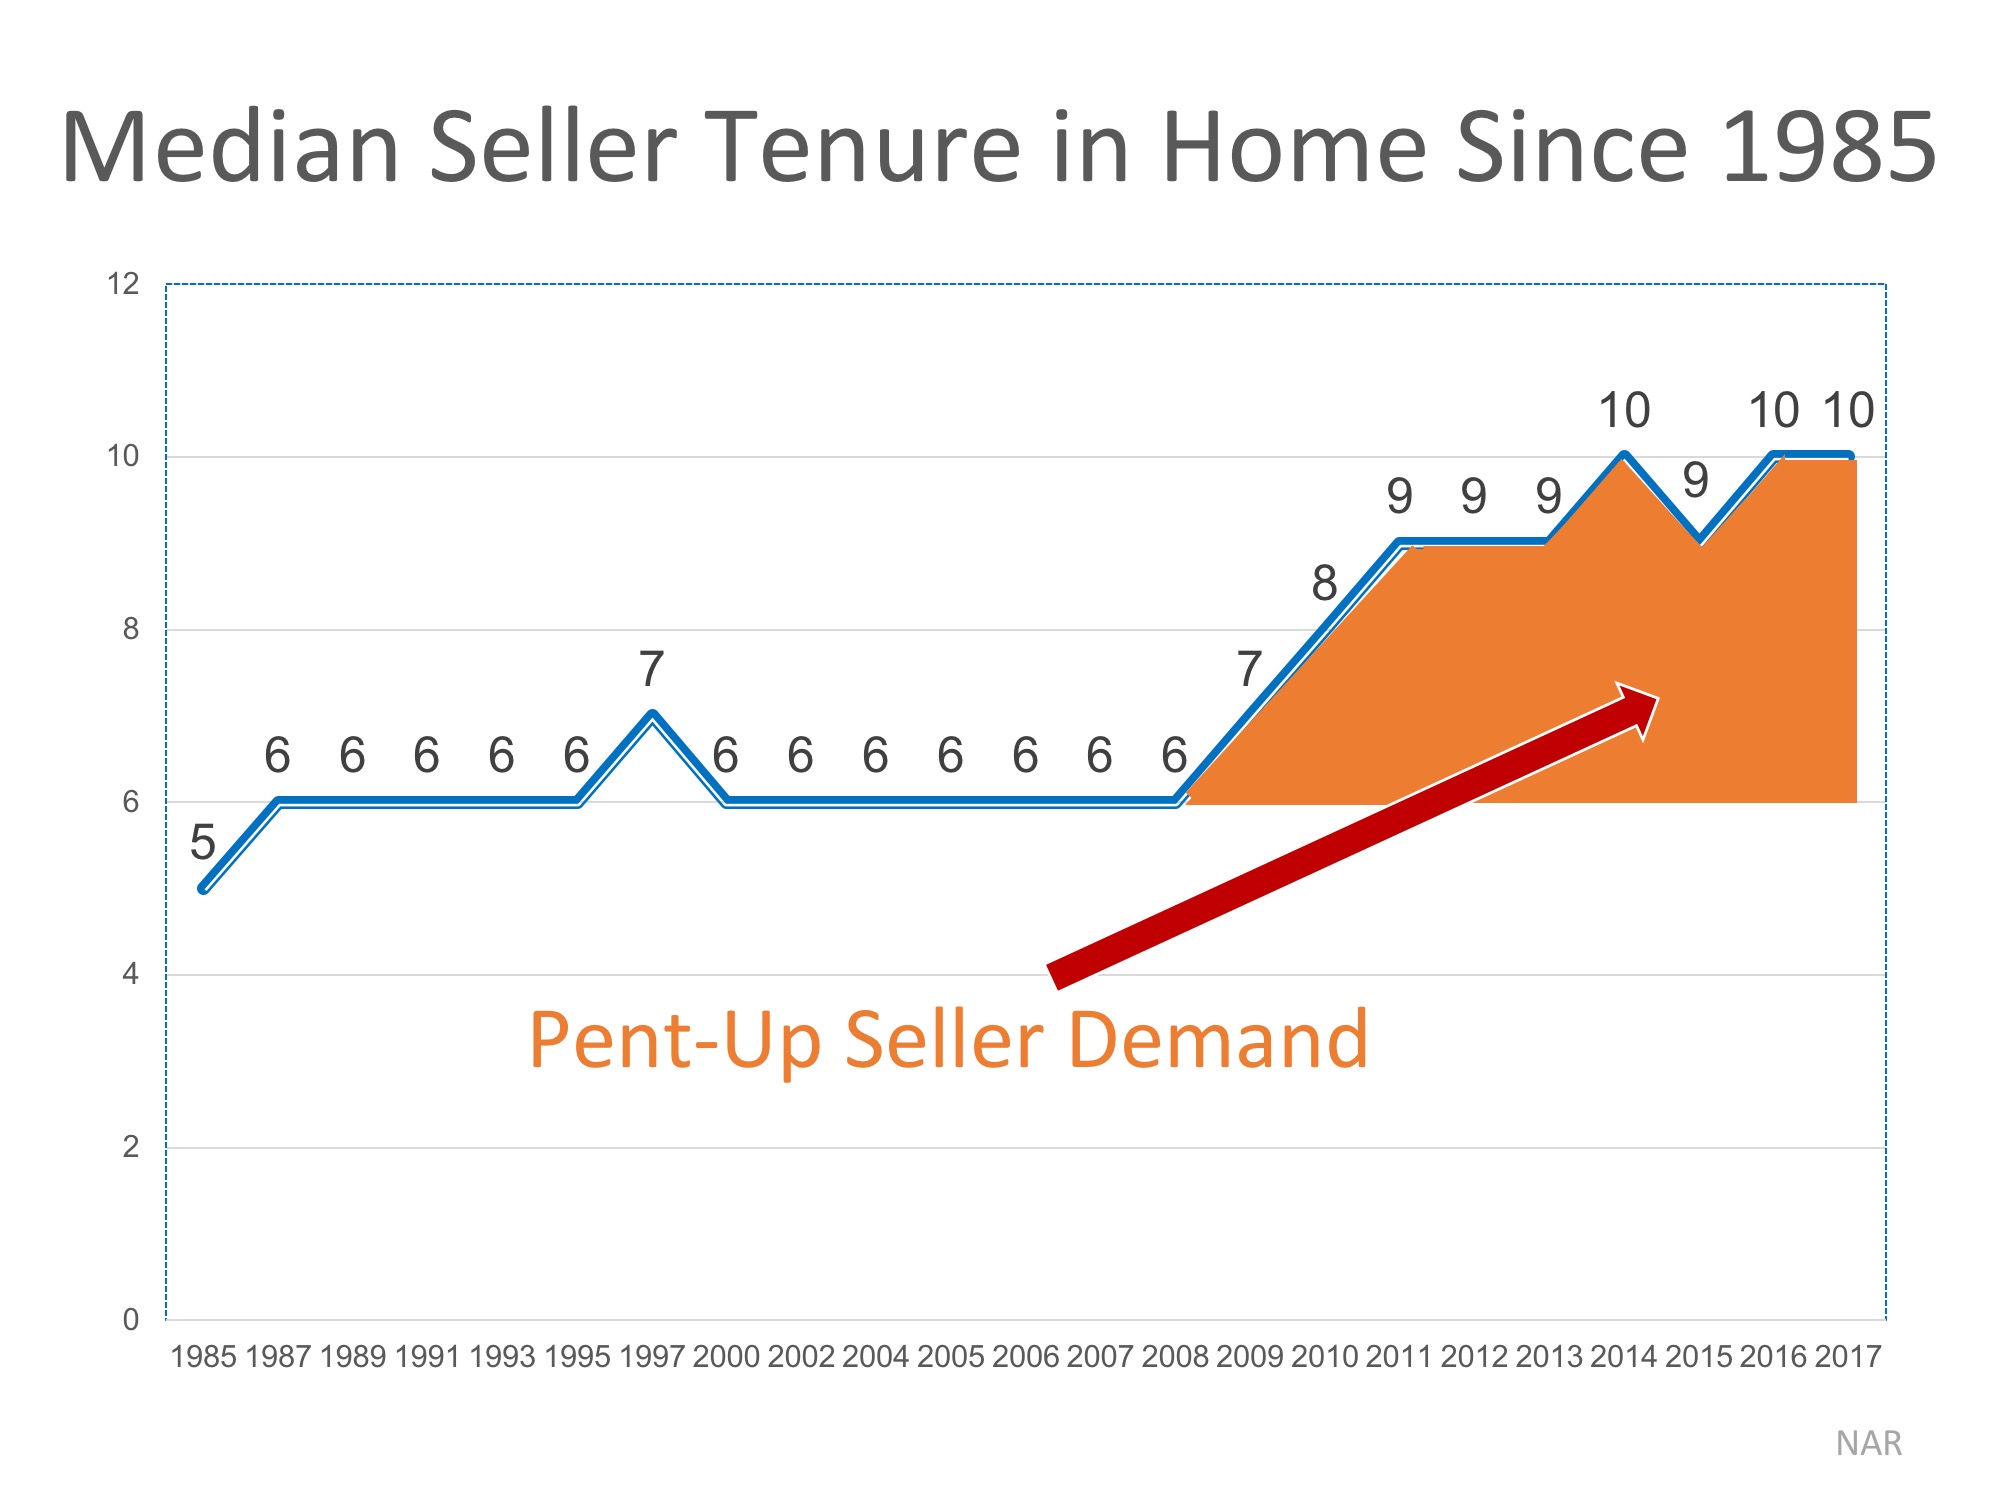
 The National Association of Realtors (NAR) keeps historical data on many aspects of homeownership. One of their data points, which has changed dramatically, is the median tenure of a family in a home, meaning how long a family stays in a home prior to moving.